
Most conversations about urban air pollution jump straight to vehicle exhaust and industrial stacks. But in many Indian cities, one of the biggest contributors to PM10 levels is something far less obvious: the fine dust sitting on our roads, getting kicked back into the air every time a vehicle drives over it.
This is called road dust resuspension, and it's driven in large part by silt load — the amount of fine, loose particulate matter present on a road surface. The higher the silt load, the more dust gets pulverized into the air with every passing wheel.
Recently, our field team at Hydrolabs was engaged by a client to generate exactly this data: scientifically sound silt load measurements across multiple road segments in the city. Our reports then went on to inform a vendor's recommendations for reducing air pollution — from road sweeping schedules to dust suppression strategies. Here's how we did it.
The Brief
Our scope was straightforward to describe and demanding to execute:
- Identify representative road segments across different parts of the city — arterial roads, residential streets, and mixed-traffic corridors
- Collect road surface samples using a standardized, scientific sampling protocol
- Analyze the samples in the lab to determine silt loading (grams of silt per square meter of road)
- Compile and share detailed reports with the client
The client would use our data as the evidence base, and a specialist vendor would translate our findings into an action plan for the city — targeted mechanical sweeping, water spraying frequency, paving of shoulders, and other dust-control interventions.
Getting The Sampling Right
Silt load data is only as good as the sampling method behind it. Our team followed a standardized field protocol at every location:
- Site selection: segments were chosen to represent a realistic cross-section of the city's road network, not just the cleanest or dirtiest stretches.
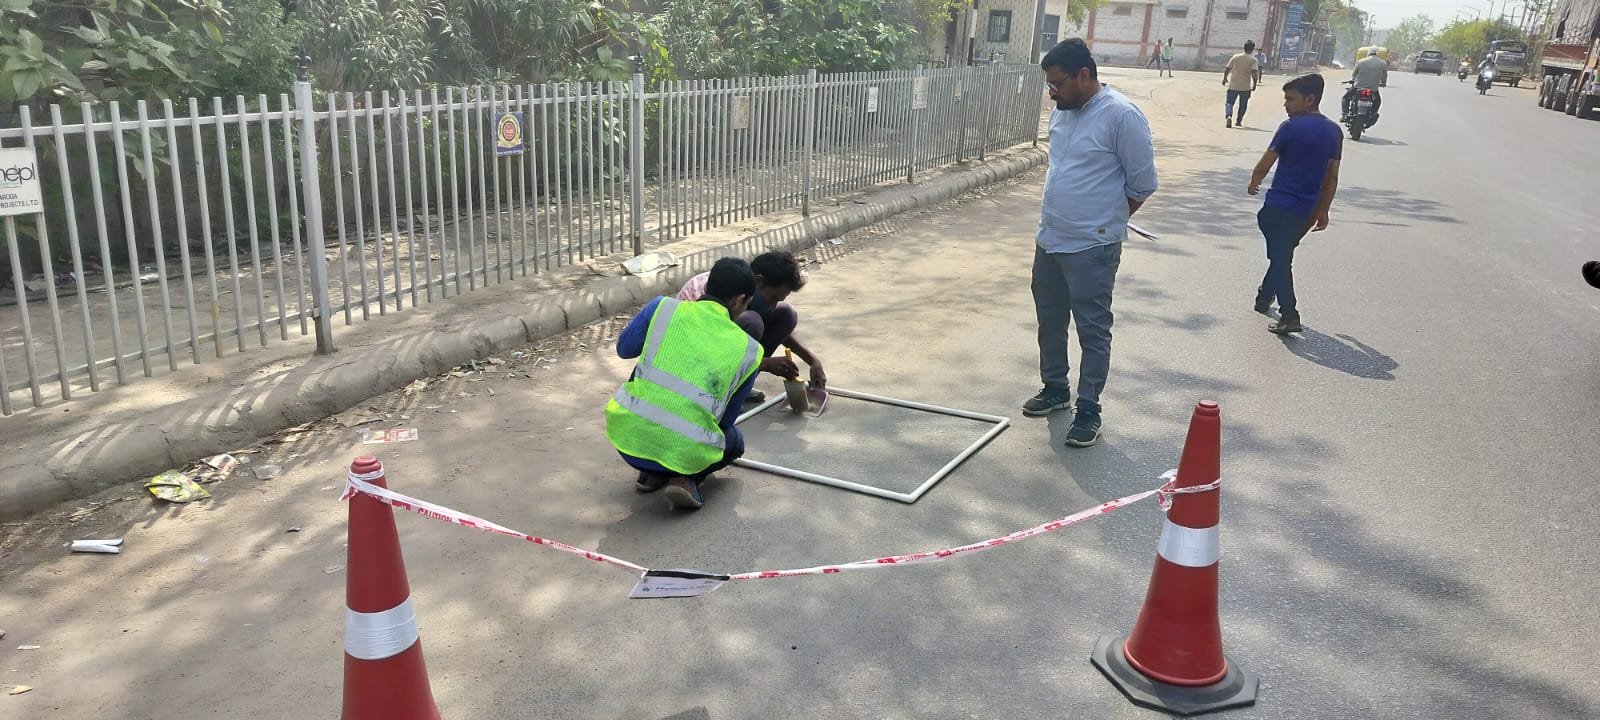
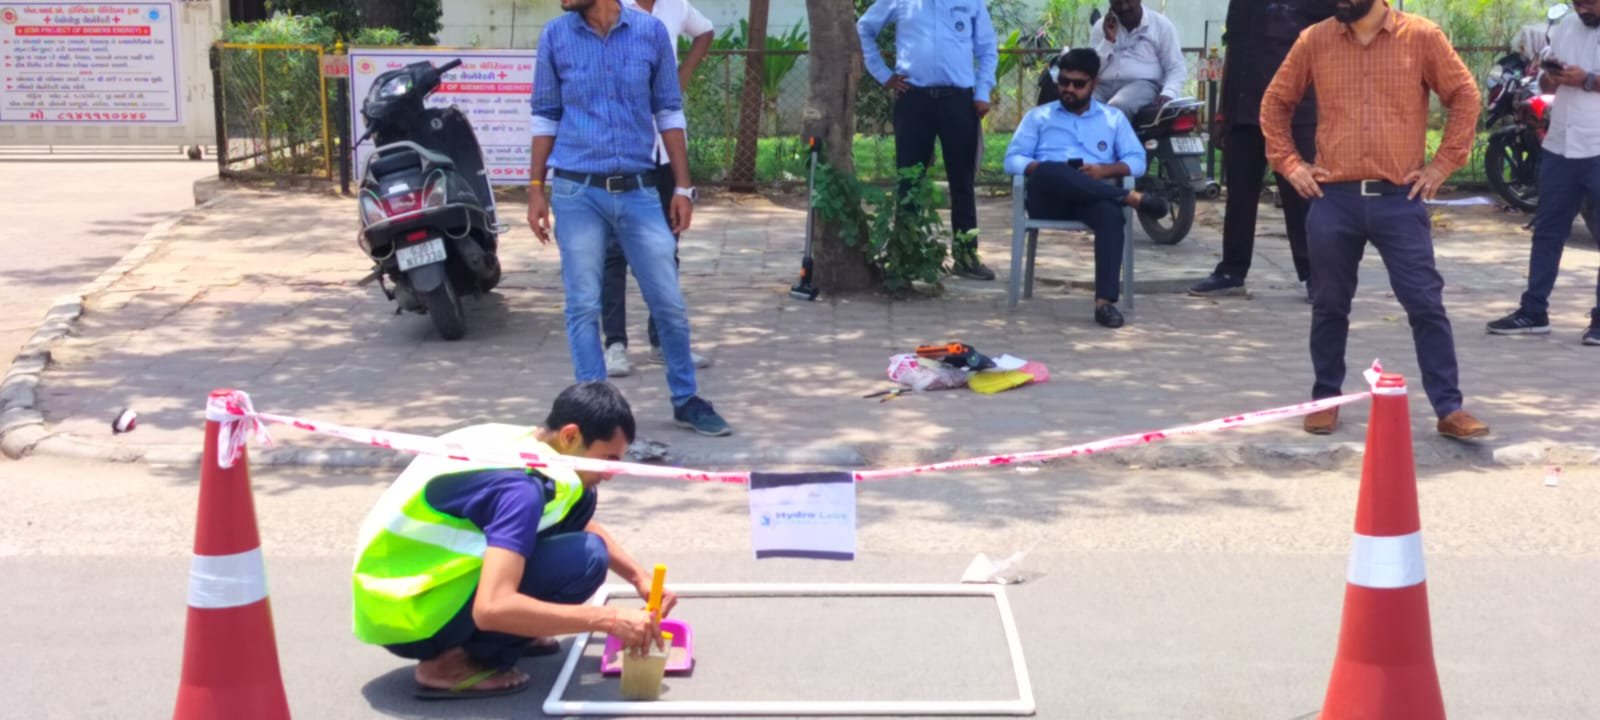
- Safe zone setup: each sampling point was cordoned off with traffic cones and hazard tape before any work began, since sampling happens on live roads with ongoing traffic.
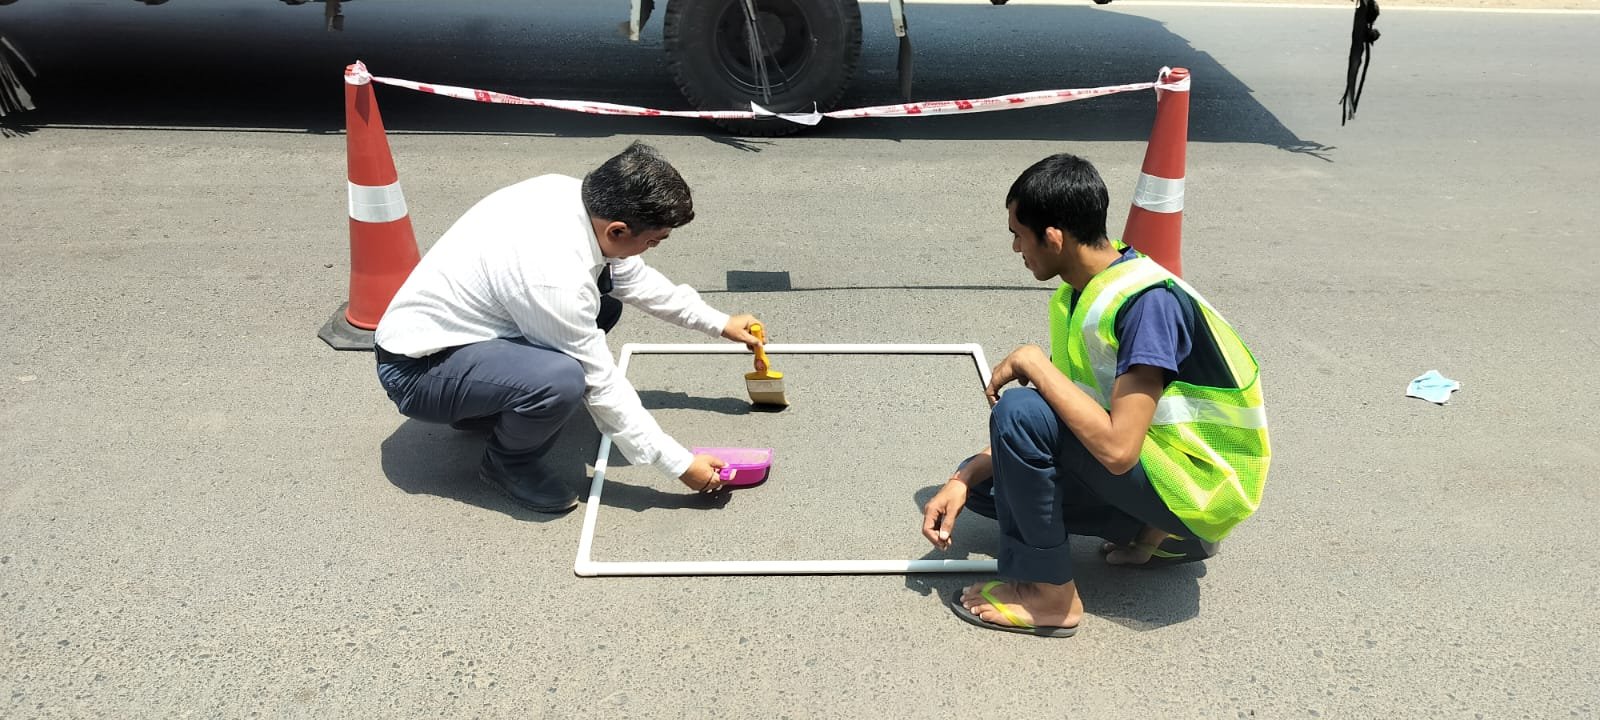
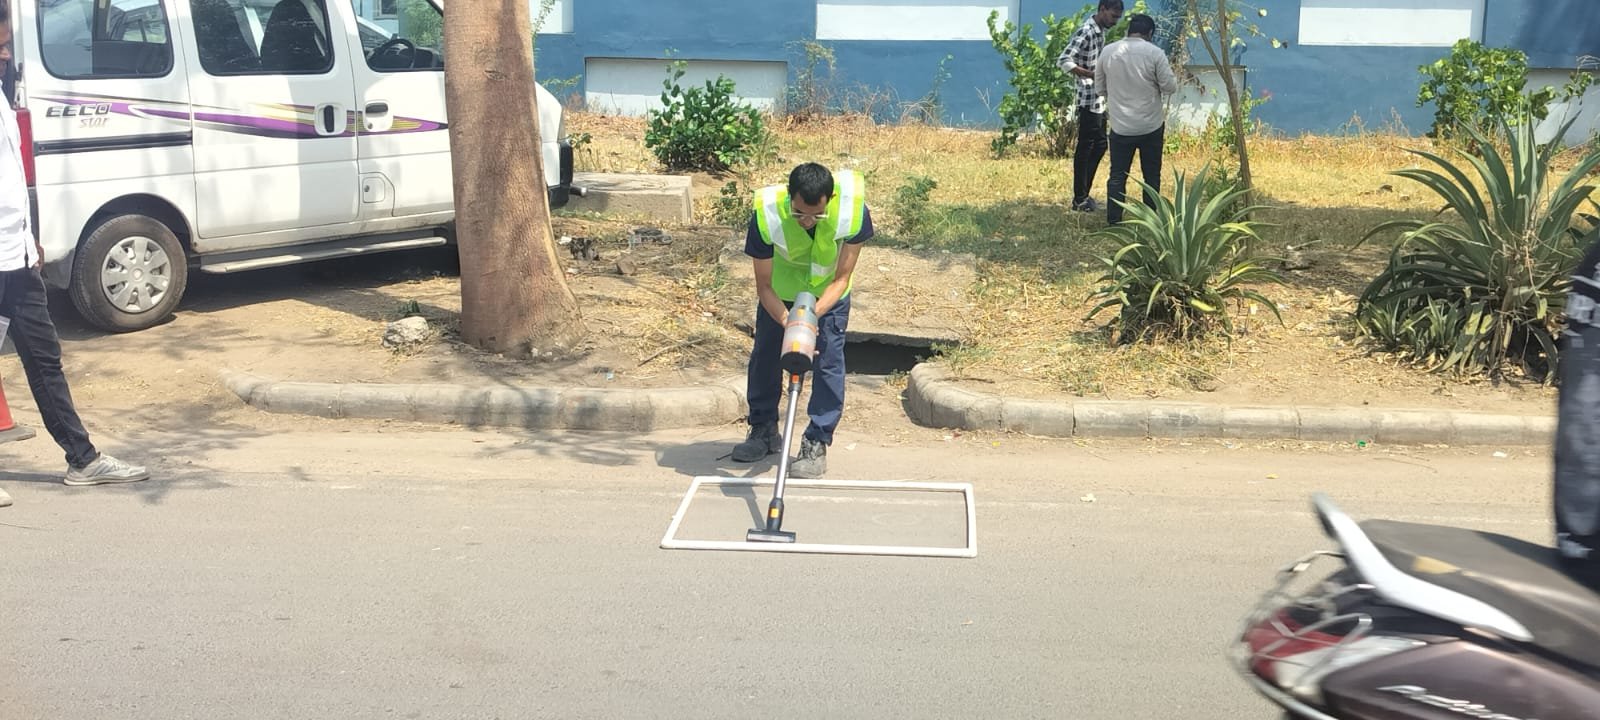
- Standard quadrat frame: a fixed-area sampling frame was laid on the road surface to ensure every sample represented the same, consistent area, making results comparable across sites.

- Careful collection: loose surface material inside the frame was swept and brushed into collection containers, minimizing loss of the finer particles that matter most for the analysis.
- Bagging and labeling: each sample was sealed and logged with its exact location, date, and time, maintaining a clean chain of custody from road to lab.
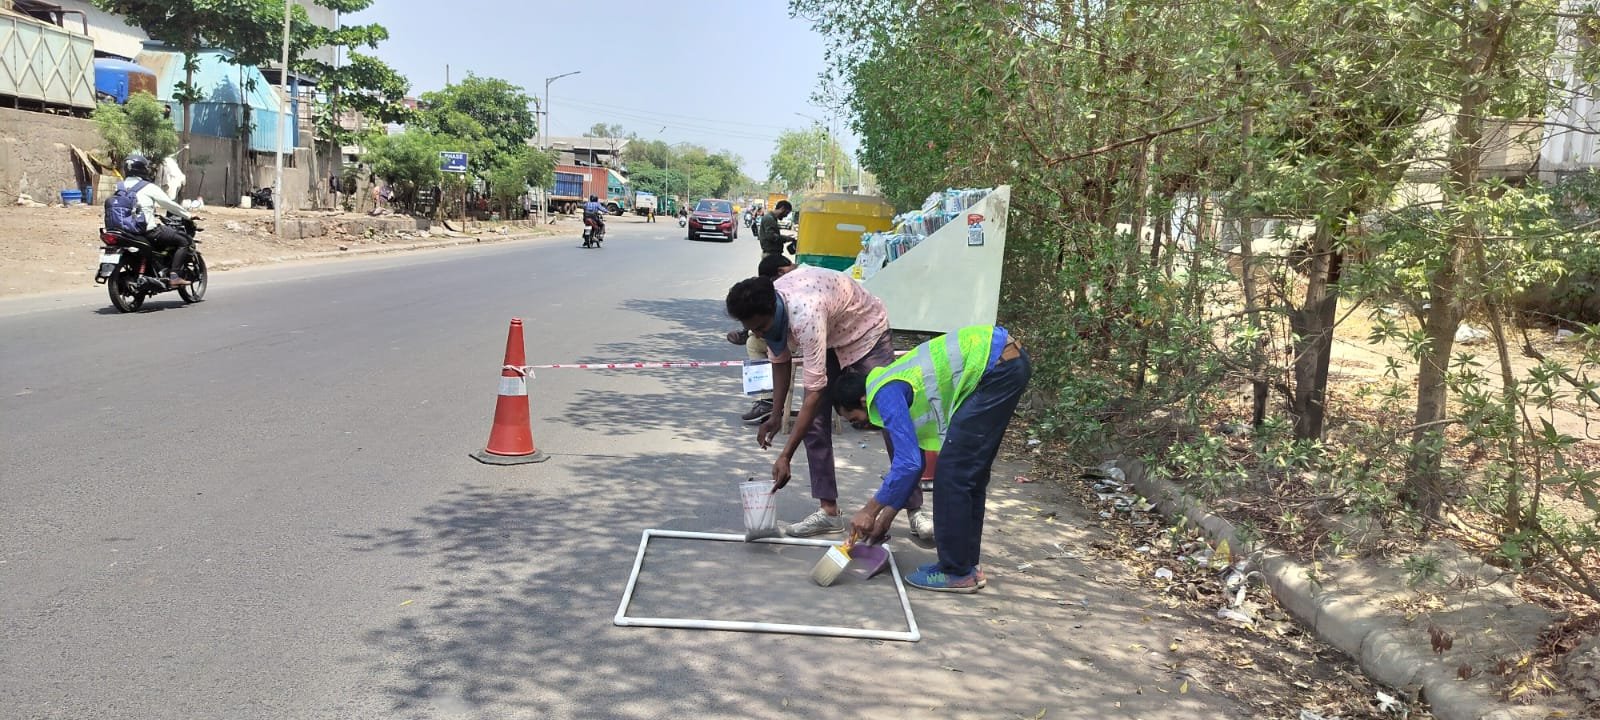
It's unglamorous work squatting on a hot road with a dustpan and brush, but the rigor of the field process is what makes the lab results defensible.
From The Road To The Report
Back at the lab, each sample went through sieve analysis to isolate the silt fraction and determine the silt loading for that segment, typically expressed in grams per square meter (g/m²). These figures were compiled into a structured report for the client, segment by segment, alongside the methodology and site details needed for the data to hold up to scrutiny.
"A morning spent measuring dust on a roadside eventually feeds into decisions that shape cleaner air for an entire city."
Silt load numbers aren't just an interesting statistic — they feed directly into established emission factor models that estimate how much PM10 a given road segment generates purely from traffic-driven dust resuspension. That's the number the vendor needed to prioritize where interventions would have the biggest impact.
Turning Data Into Action
Once our reports were in hand, the appointed vendor used the silt load findings to recommend targeted air pollution reduction measures — including which corridors needed more frequent mechanical sweeping, where water spraying would cut resuspension most effectively, and which unpaved shoulders were contributing disproportionately to the dust load.
This is the part of the work we find most satisfying: a morning spent measuring dust on a roadside eventually feeds into decisions that shape cleaner air for an entire city.
Why It Matters
Air quality management is often treated as a policy or engineering problem, but it starts with reliable ground-truth data. Silt load sampling is a good example of the unglamorous, meticulous fieldwork that sits underneath every credible pollution-reduction plan and it's exactly the kind of work Hydrolabs specializes in: going out into the field, following a rigorous scientific protocol, and delivering data that clients and their partners can act on with confidence.
If your organization needs field data you can trust — whether it's silt load, water quality, soil, or air monitoring — reach out to our team to learn how we can support your project.
Explore Air Quality & Emissions