Dashboarding
Live, decision-ready dashboards bring all your testing, monitoring and audit data into one clear view — by site, parameter or programme.
We don't stop at reports. HydroLabs turns your testing, monitoring and audit data into live dashboards, trends and AI-driven insights — so you can act early and prove assurance.
Three capabilities that turn laboratory results into a continuous assurance system.
Live, decision-ready dashboards bring all your testing, monitoring and audit data into one clear view — by site, parameter or programme.
Track every parameter over time to see drift before it becomes a failure — turning one-off results into an early-warning system.
Predictive risk scoring, anomaly detection and smart alerts surface what needs attention first — so teams act before problems escalate.
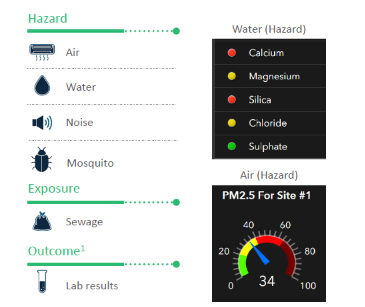
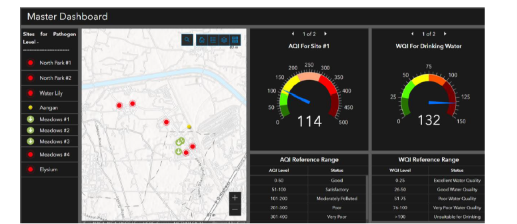
Master Dashboard has indices for Air Quality and Water Quality indicators and shows change in COVID-19 viral load. Individual dashboards for Air, Water and Sewage can identify individual pollutants/pathogens to focus on.
Every sample, parameter and audit finding — connected, trended and monitored — across both NABL accredited laboratories and all your sites.
Talk to our specialists about the right scope, parameters and turnaround — or request a quote today.